Example backtest report for a sample strategy, Meridian ORB: its first journal rows and the summary card, which rates the backtest Worked and very unlikely to be luck, with +202R over 717 trades since Jan 2021.
Backtest
Understand your backtest before you trade it.
Know which strategies deserve your money. Quantprove turns your backtest into answers you can act on.
Launch demo



%20--%3e%3csvg%20version='1.1'%20id='Layer_1'%20xmlns='http://www.w3.org/2000/svg'%20xmlns:xlink='http://www.w3.org/1999/xlink'%20x='0px'%20y='0px'%20viewBox='0%200%201101.64%20196.79'%20style='enable-background:new%200%200%201101.64%20196.79;'%20xml:space='preserve'%3e%3cstyle%20type='text/css'%3e%20.st0{fill:%230052FF;}%20%3c/style%3e%3cpath%20class='st0'%20d='M222.34,54.94c-40.02,0-71.29,30.38-71.29,71.05s30.48,70.79,71.29,70.79c40.81,0,71.82-30.64,71.82-71.05%20C294.16,85.58,263.68,54.94,222.34,54.94z%20M222.61,167.47c-22.79,0-39.49-17.7-39.49-41.47c0-24.04,16.43-41.73,39.22-41.73%20c23.06,0,39.75,17.96,39.75,41.73S245.4,167.47,222.61,167.47z%20M302.9,85.85h19.88v108.3h31.8V57.58H302.9V85.85z%20M71.02,84.26%20c16.7,0,29.95,10.3,34.98,25.62h33.66c-6.1-32.75-33.13-54.94-68.37-54.94C31.27,54.94,0,85.32,0,126s30.48,70.79,71.29,70.79%20c34.45,0,62.01-22.19,68.11-55.21H106c-4.77,15.32-18.02,25.89-34.72,25.89c-23.06,0-39.22-17.7-39.22-41.47%20C32.07,101.96,47.97,84.26,71.02,84.26z%20M907.12,112.79l-23.32-3.43c-11.13-1.58-19.08-5.28-19.08-14%20c0-9.51,10.34-14.26,24.38-14.26c15.37,0,25.18,6.6,27.3,17.43h30.74c-3.45-27.47-24.65-43.58-57.24-43.58%20c-33.66,0-55.92,17.17-55.92,41.47c0,23.24,14.58,36.72,43.99,40.94l23.32,3.43c11.4,1.58,17.76,6.08,17.76,14.53%20c0,10.83-11.13,15.32-26.5,15.32c-18.82,0-29.42-7.66-31.01-19.28h-31.27c2.92,26.68,23.85,45.43,62.01,45.43%20c34.72,0,57.77-15.85,57.77-43.06C950.05,129.43,933.36,116.75,907.12,112.79z%20M338.68,1.32c-11.66,0-20.41,8.45-20.41,20.07%20s8.74,20.07,20.41,20.07c11.66,0,20.41-8.45,20.41-20.07S350.34,1.32,338.68,1.32z%20M805.36,104.34c0-29.58-18.02-49.39-56.18-49.39%20c-36.04,0-56.18,18.23-60.16,46.23h31.54c1.59-10.83,10.07-19.81,28.09-19.81c16.17,0,24.12,7.13,24.12,15.85%20c0,11.36-14.58,14.26-32.6,16.11c-24.38,2.64-54.59,11.09-54.59,42.79c0,24.57,18.29,40.41,47.44,40.41%20c22.79,0,37.1-9.51,44.26-24.57c1.06,13.47,11.13,22.19,25.18,22.19h18.55v-28.26h-15.64V104.34z%20M774.09,138.68%20c0,18.23-15.9,31.7-35.25,31.7c-11.93,0-22-5.02-22-15.58c0-13.47,16.17-17.17,31.01-18.75c14.31-1.32,22.26-4.49,26.24-10.57%20V138.68z%20M605.28,54.94c-17.76,0-32.6,7.4-43.2,19.81V0h-31.8v194.15h31.27v-17.96c10.6,12.94,25.71,20.6,43.73,20.6%20c38.16,0,67.05-30.11,67.05-70.79S642.91,54.94,605.28,54.94z%20M600.51,167.47c-22.79,0-39.49-17.7-39.49-41.47%20s16.96-41.73,39.75-41.73c23.06,0,39.22,17.7,39.22,41.73C639.99,149.77,623.3,167.47,600.51,167.47z%20M454.22,54.94%20c-20.67,0-34.19,8.45-42.14,20.34v-17.7h-31.54v136.56h31.8v-74.22c0-20.87,13.25-35.66,32.86-35.66c18.29,0,29.68,12.94,29.68,31.7%20v78.19h31.8v-80.56C506.69,79.24,488.94,54.94,454.22,54.94z%20M1101.64,121.51c0-39.09-28.62-66.56-67.05-66.56%20c-40.81,0-70.76,30.64-70.76,71.05c0,42.53,32.07,70.79,71.29,70.79c33.13,0,59.1-19.55,65.72-47.28h-33.13%20c-4.77,12.15-16.43,19.02-32.07,19.02c-20.41,0-35.78-12.68-39.22-34.87h105.21V121.51z%20M998.28,110.94%20c5.04-19.02,19.35-28.26,35.78-28.26c18.02,0,31.8,10.3,34.98,28.26H998.28z'/%3e%3c/svg%3e)




What your backtest is really saying. The three answers to know before you go live.
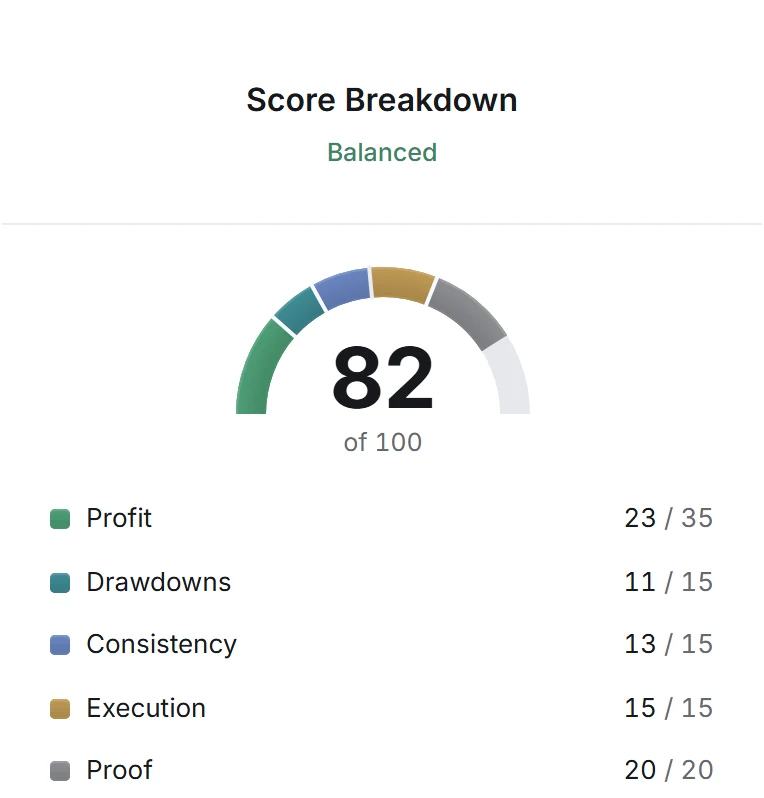
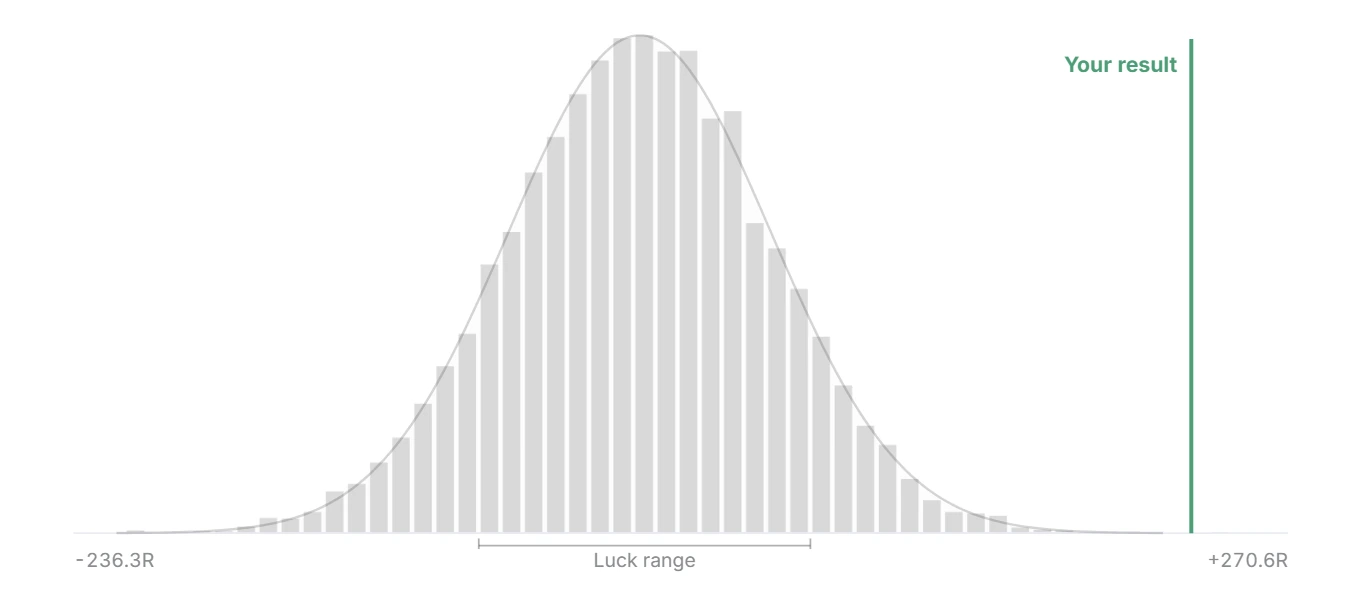
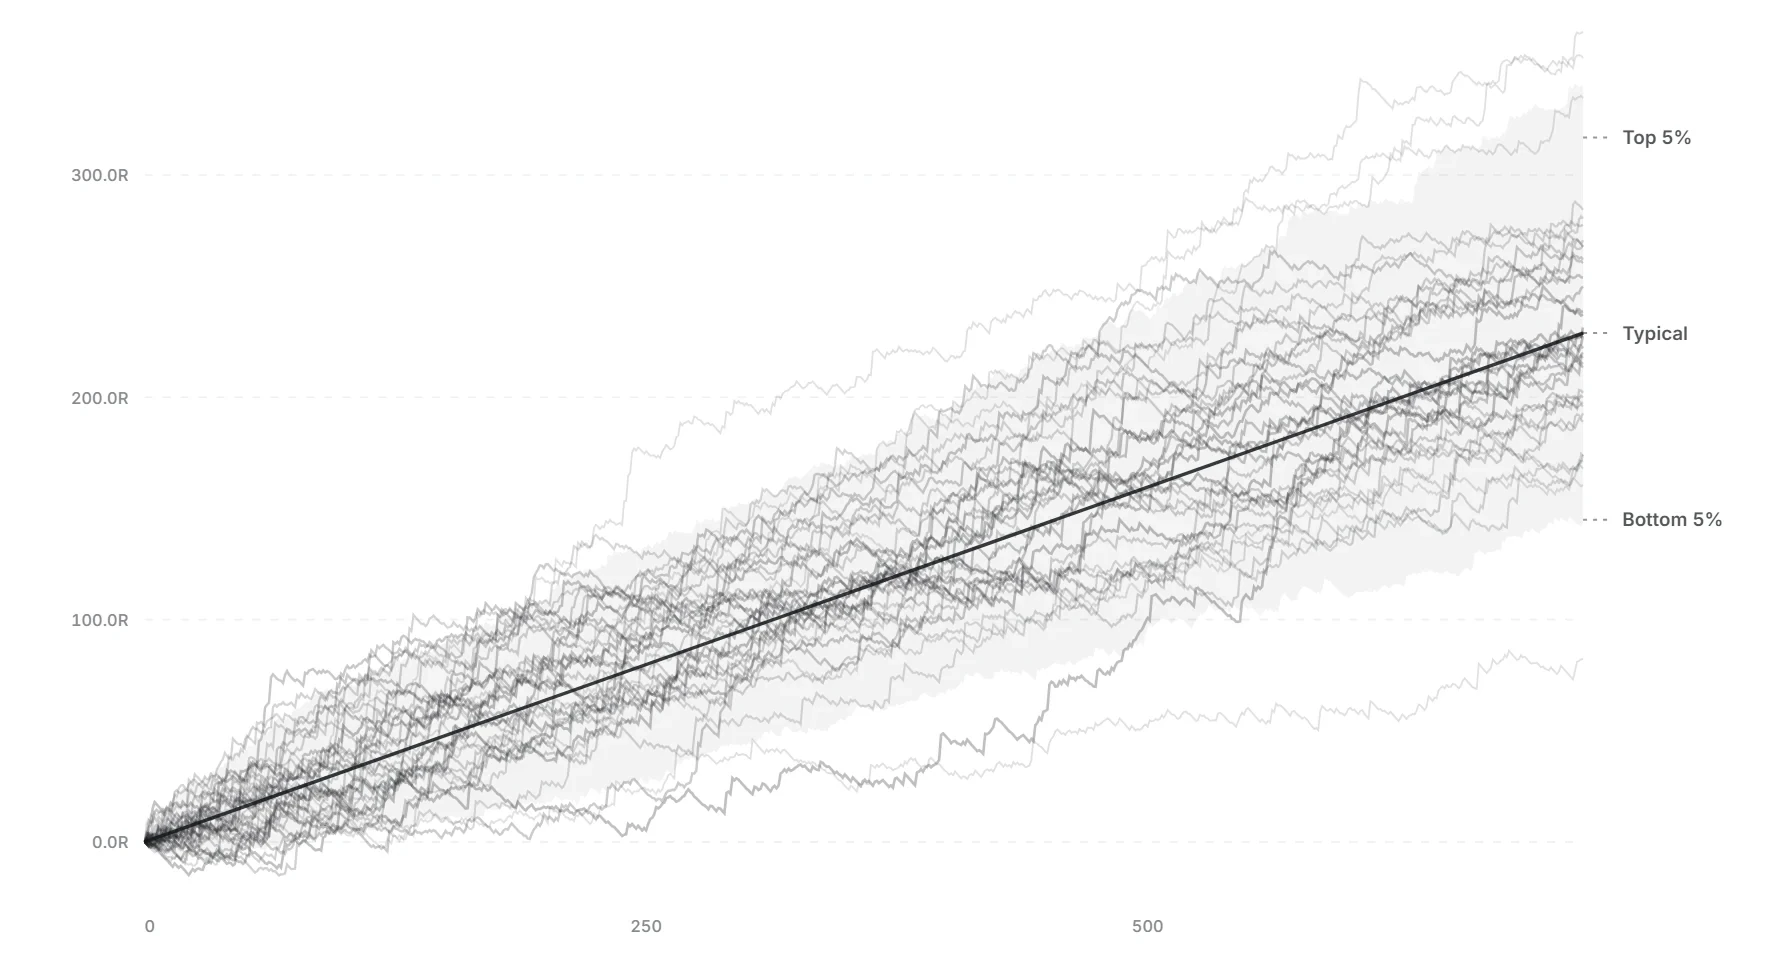
Take a look inside a report. Every section answers one question.
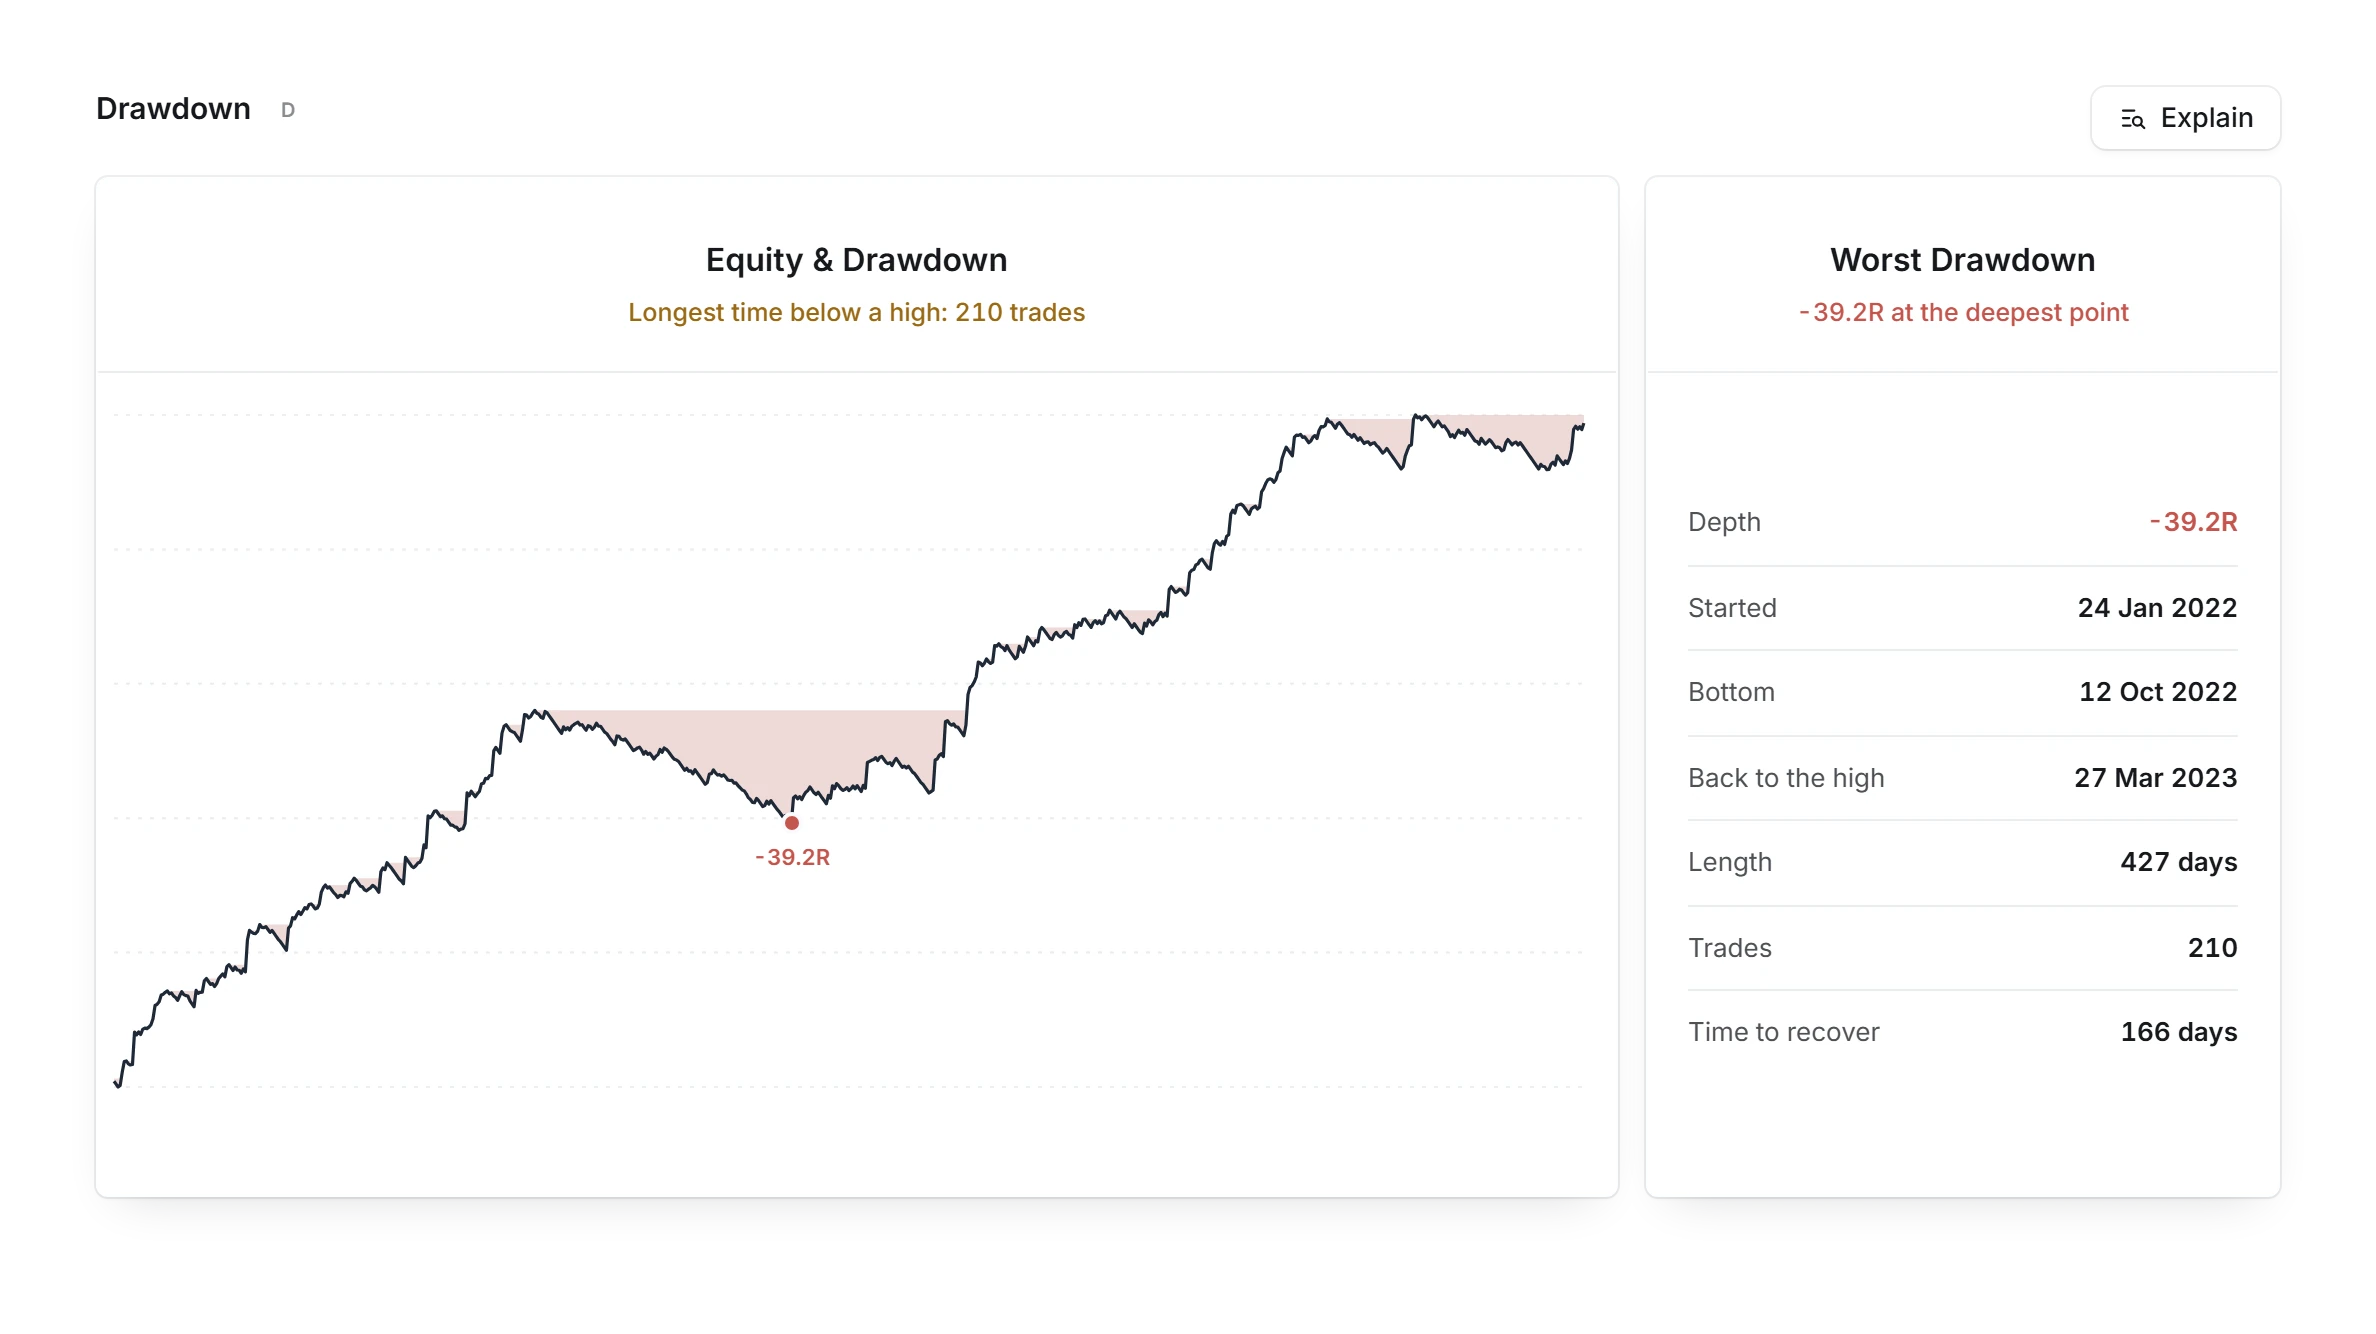
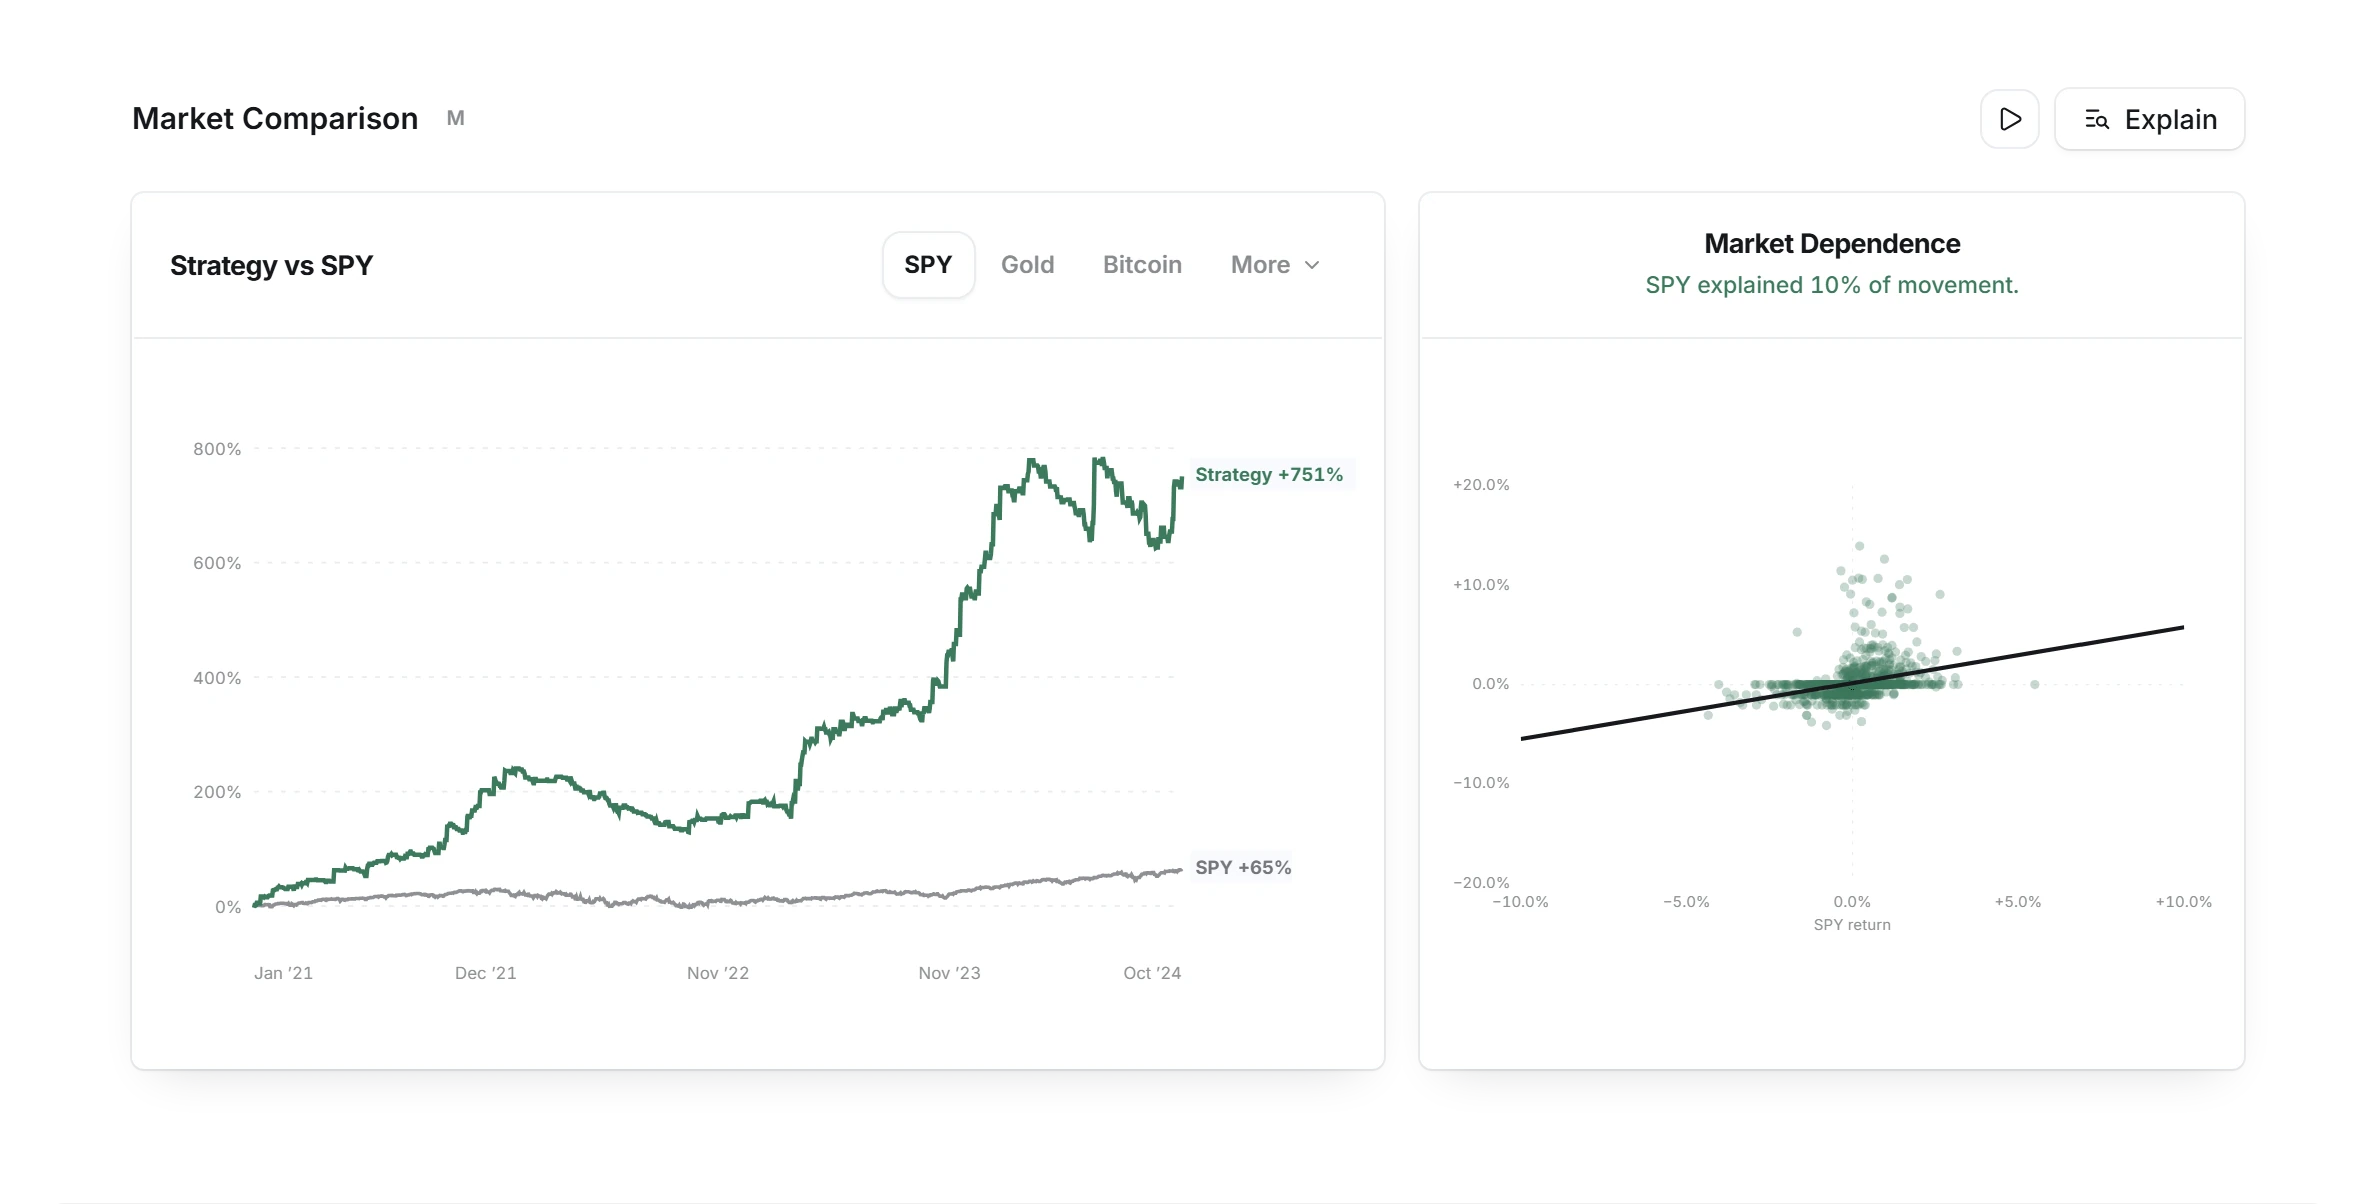
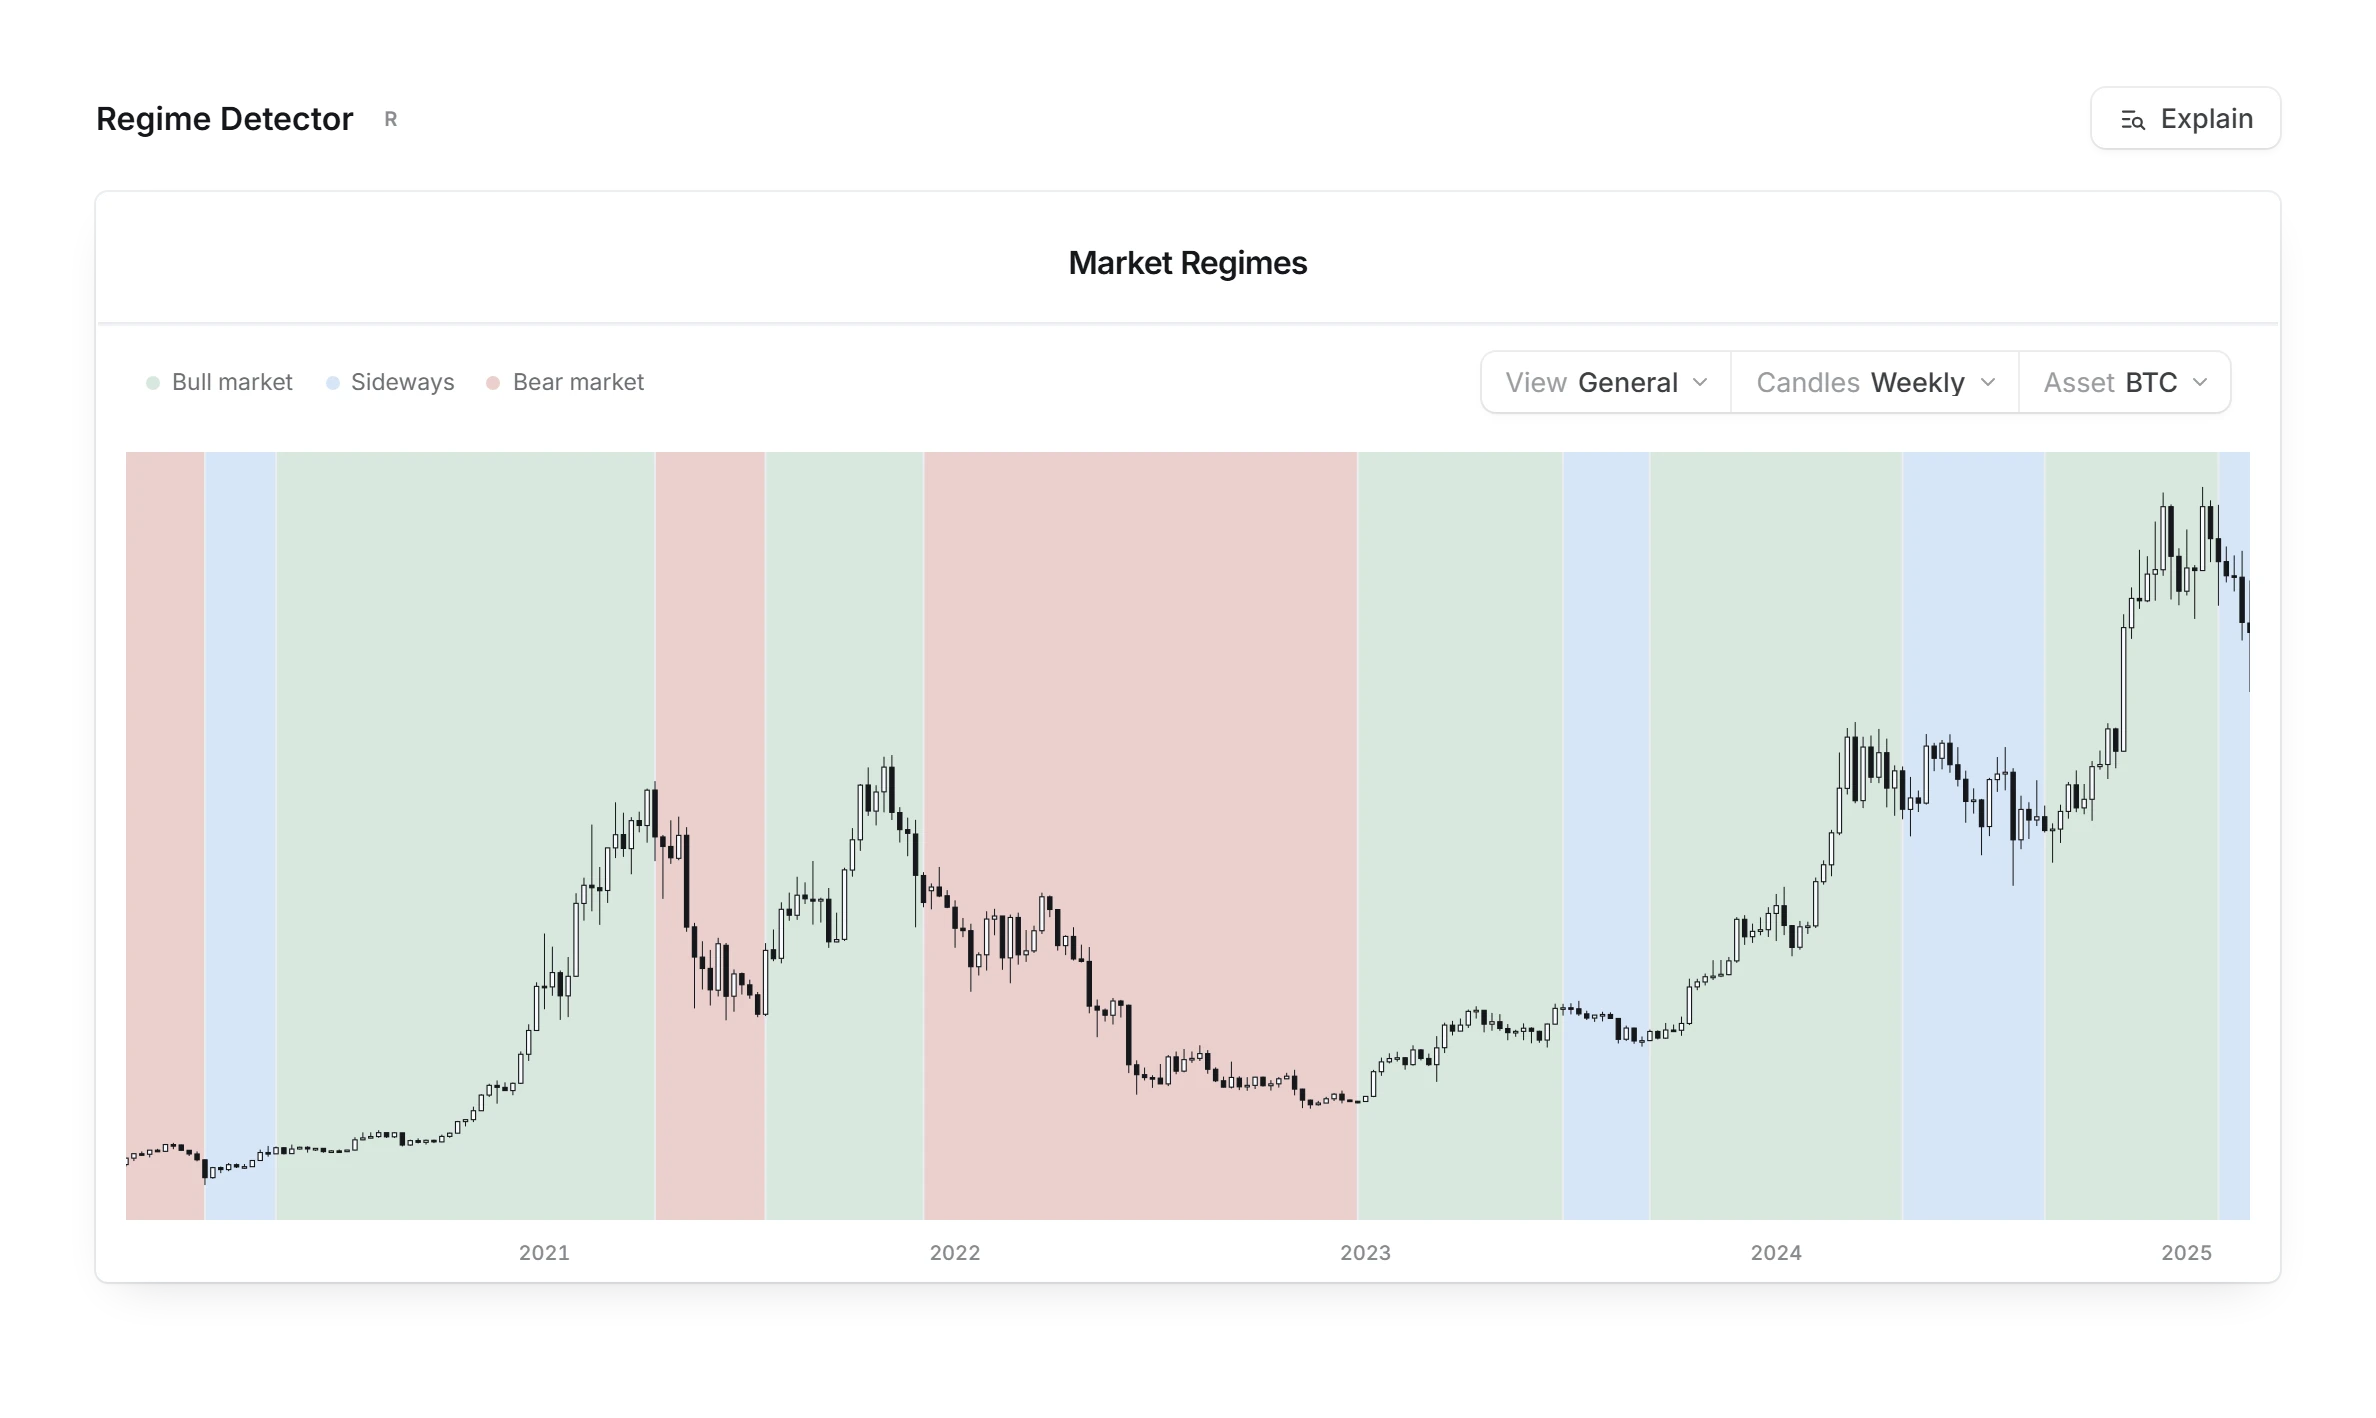
Honest about what it can't tell. Every number arrives with how sure it is.
 Interactive Brokers
Fees counted in.
Pick your broker and its published fees come off every trade, so the result is closer to what you would keep.
Enough trades to trust?
Under 200 trades, a backtest is marked as a low sample. From 500, the sample counts as big.
Every number explained.
Press Explain on any section to see what it measures, your result and how to use it.
Ready for live trading. A backtest is where the evidence starts.
Which months carried it?
Every month of the test side by side, so one lucky stretch cannot hide.
How long do losing streaks run?
See how many losses in a row the test went through, so a normal streak does not shake you live.
Did it hold in every period?
The test splits into three parts. A real edge makes money in each of them.
Next step: Validation.
Connect your broker and Validation compares your live trades with this backtest.
Bring your backtest from anywhere.
MT4 and MT5 Strategy Tester reports, TradingView strategy exports, CSV, Excel, HTML or PDF files. Or import from Notion and Google Sheets.


From file to report in three steps. No setup, no code.
Export your test.
Save your backtest data from Excel, Google Sheets, TradingView or Notion.
Drop the file.
Quantprove reads the trades and shows you the columns it found before anything is saved.
Read the report.
Edge Score, luck test, split test and Monte Carlo range, on one page.
One strategy, from test to live.
Every step works from the same record.
Frequently asked questions.
Quantprove analyzes a backtest you already ran in MT4 or MT5 Strategy Tester, TradingView or a spreadsheet and gives it an Edge Score out of 100. Behind the score are a luck test over 10,000 random runs, a split test, a Monte Carlo range for live trading, market regimes and results after your broker’s fees. It does not run backtests itself.
Quantprove checks if the edge survives on the part of the test the rules weren’t tuned on: it splits your backtest and shows how much of the edge each part keeps. It also runs a luck test and shows how much of the profit came from a few big trades. What overfitting means.
Ask the seller for the full backtest report and upload it to Quantprove. A real edge survives the split test, beats the luck test and doesn’t rest on a handful of big wins. Even then a backtest is only a starting point: ask for live results from a connected broker too.
Yes, a forex EA backtest report is a file that can be edited or cherry-picked, and Quantprove can’t confirm it came from a real test. What Quantprove shows are the usual signs of a weak one: too few trades, results that rest on a few big wins, and an edge that fades in the later part of the test.
Quantprove can check both halves of a forex EA seller’s claim: upload the full backtest report to see if the edge is real, then ask for a Quantprove Passport of the live account the EA trades on. A seller who shares neither is the warning sign.
Quantprove scores a backtest from 30 trades, marks it as a low sample under 200, and counts 500 or more as a big sample. Fewer trades make the score less certain, not wrong: start at 30 and let more trades settle it.